Proof-of-Concept Design and Validation
Key concepts
Rapid prototyping with Bedrock
Validation metrics definition
A/B testing for model selection
Business value demonstration
Scaling from POC to production
Overview
A well-designed Proof of Concept (POC) is critical for validating GenAI solutions before committing to production deployment. POCs help demonstrate business value, validate technical feasibility, compare model options, and establish baseline metrics for success.
Amazon Bedrock's serverless architecture makes it ideal for rapid prototyping - you can test multiple foundation models without infrastructure setup. This topic covers the POC lifecycle from rapid prototyping through validation metrics to scaling for production.
Key Principle
A successful GenAI POC proves business value with measurable metrics. Define success criteria upfront, use representative data, and validate with stakeholders before scaling to production.
Expect questions about POC validation approaches, including what metrics to use, how to structure A/B tests, and when a POC is ready for production. Know the difference between exploration, production, and reinvention stages.
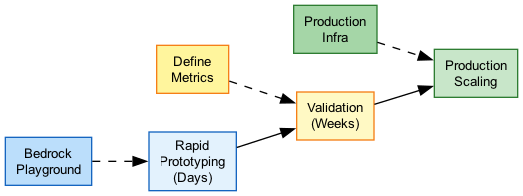
Architecture Diagram
The following diagram illustrates the POC lifecycle for GenAI applications:
Key Concepts
Rapid Prototyping with Bedrock
Rapid Prototyping
Amazon Bedrock enables fast POC development:
Serverless Access:
- No infrastructure to provision
- Immediate access to foundation models
- Pay only for what you use during testing
- Switch models without code changes
Prototyping Tools:
- Bedrock Console Playground - Test prompts interactively
- Bedrock Studio - Collaborative prototyping environment
- AWS SDKs - Programmatic experimentation
- Jupyter Notebooks - Data science workflows
Rapid Testing Workflow:
- Define use case and sample prompts
- Test in Playground with different models
- Iterate on prompt engineering
- Evaluate outputs qualitatively
- Move to programmatic testing
POC Architecture
Minimal POC Architecture:
User → API Gateway → Lambda → Bedrock
                        ↓
                   DynamoDB (logs)
Components:
- API Gateway - REST endpoint for testing
- Lambda - Orchestration and preprocessing
- Bedrock - Model inference
- DynamoDB/S3 - Store prompts and responses for analysis
Time to Build: 1-2 days for basic POC Cost: Pay-per-use, minimal during testing
POC Development Approaches
| Approach | Time | Best For | Tools |
|---|---|---|---|
| Console Playground | Minutes | Initial exploration, prompt testing | Bedrock Console |
| Bedrock Studio | Hours | Team collaboration, demos | Bedrock Studio |
| Notebook Prototyping | Hours-Days | Data analysis, batch testing | SageMaker, Jupyter |
| Full POC Build | 1-2 Weeks | End-to-end validation | CDK, Lambda, API Gateway |
Validation Metrics Definition
Success Metrics
Define measurable success criteria before starting:
Quality Metrics:
- Accuracy - % of correct/factual responses
- Relevance - How well responses address queries
- Completeness - Are all required elements present?
- Fluency - Natural language quality score
- Hallucination Rate - % of fabricated content
Performance Metrics:
- Latency - Time to first token, total response time
- Throughput - Requests handled per minute
- Error Rate - % of failed requests
- Availability - Uptime during testing
Business Metrics:
- Task Completion Rate - % of tasks successfully completed
- User Satisfaction - Qualitative feedback scores
- Time Savings - Compared to manual process
- Cost per Transaction - Token costs per use case
Metric Thresholds
Setting Validation Thresholds:
Example Thresholds for Customer Support Bot: | Metric | Target | Minimum | |--------|--------|---------| | Accuracy | >90% | 85% | | Relevance | >85% | 80% | | Latency (P95) | <2s | <5s | | Hallucination Rate | <5% | <10% | | User Satisfaction | >4.0/5 | 3.5/5 |
Threshold Setting Process:
- Benchmark current process (if exists)
- Define "good enough" for MVP
- Set stretch goals for future iterations
- Get stakeholder alignment on thresholds
Statistical Validation
Run statistically significant sample sizes - typically hundreds of test cases - to achieve high confidence intervals. A handful of test prompts is insufficient for production decisions.
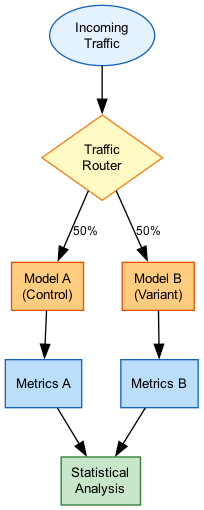
A/B Testing for Model Selection
A/B Testing Setup
Compare models systematically with A/B testing:
A/B Testing Architecture:
Request → Router → Model A (50%)
              ↓
          Model B (50%)
              ↓
         Results DB → Analysis
What to A/B Test:
- Different foundation models (Claude vs Llama)
- Model versions (Claude 3 vs Claude 3.5)
- Prompt variations
- System prompt configurations
- Temperature/parameter settings
Implementation Options:
- Lambda-based routing
- Feature flags (AppConfig)
- Bedrock Intelligent Prompt Routing
A/B Test Analysis
Analyzing A/B Test Results:
Key Comparisons:
-
Quality Comparison
- Run same prompts through both models
- Use LLM-as-judge for automated scoring
- Include human evaluation for nuance
-
Performance Comparison
- Compare latency distributions
- Measure throughput capacity
- Evaluate error rates
-
Cost Comparison
- Calculate cost per 1000 requests
- Factor in token efficiency
- Project to production scale
Statistical Significance:
- Minimum 100+ samples per variant
- 95% confidence interval typical
- Use hypothesis testing for decisions
A/B Test Metrics
| Metric Category | Metric | How to Measure |
|---|---|---|
| Quality | Accuracy | Compare to ground truth dataset |
| Quality | Preference | Human evaluator picks preferred response |
| Performance | Latency | P50, P90, P99 response times |
| Performance | Error Rate | % of failed requests |
| Cost | Cost/Request | Total tokens × price per token |
| User | Task Success | % of tasks completed successfully |
Business Value Demonstration
Value Demonstration
Proving business value to stakeholders:
ROI Components:
-
Cost Savings
- Labor reduction vs manual process
- Time savings per task
- Error reduction costs avoided
-
Revenue Impact
- Faster customer response → higher conversion
- Better recommendations → increased sales
- 24/7 availability → more coverage
-
Quality Improvements
- Consistency of responses
- Reduced human error
- Scalability without quality loss
Value Calculation Example:
Current: 10,000 queries/month × 5 min/query × $25/hr = $20,833/month
GenAI:   10,000 queries/month × 1 min/query × $25/hr = $4,167/month
         + Bedrock costs (~$500/month)
Savings: $16,166/month (78% reduction)
Stakeholder Presentation
POC Results Presentation:
Structure:
- Problem Statement - What we're solving
- Approach - How we tested it
- Results - Metrics achieved vs targets
- Demos - Live or recorded examples
- Risks - Identified limitations
- Recommendation - Go/no-go decision
- Next Steps - Path to production
Key Artifacts:
- Golden dataset with sample prompts/responses
- Metrics dashboard showing results
- Cost projections at scale
- Risk mitigation plan
- Production architecture proposal
Scaling from POC to Production
POC to Production Gap
Common challenges when scaling:
Technical Challenges:
- POC latency ≠ production latency under load
- Edge cases not covered in testing
- Integration complexity with existing systems
- Security and compliance requirements
Operational Challenges:
- Monitoring and alerting setup
- On-call and support processes
- Cost management at scale
- Model drift and quality degradation
Organizational Challenges:
- Change management for users
- Training and documentation
- Governance and approval workflows
- Ongoing ownership and maintenance
Production Readiness Checklist
Before scaling to production:
Architecture:
- [ ] Load tested at 2-3x expected peak
- [ ] Error handling and retries implemented
- [ ] Fallback strategies defined
- [ ] Multi-region if required
Security:
- [ ] VPC endpoints configured
- [ ] IAM roles with least privilege
- [ ] Data encryption (transit/rest)
- [ ] Guardrails enabled
Operations:
- [ ] CloudWatch dashboards created
- [ ] Alerting thresholds defined
- [ ] Runbooks documented
- [ ] On-call rotation established
Quality:
- [ ] Evaluation pipeline automated
- [ ] Golden dataset maintained
- [ ] Human feedback loop planned
- [ ] Model update process defined
GenAIOps Maturity Stages
| Stage | Characteristics | Focus |
|---|---|---|
| Exploration | 1-3 POCs, small team, proving value | Validate fit, learn capabilities |
| Production | Multiple use cases, scaling challenges | Operationalize, standardize patterns |
| Reinvention | Enterprise strategy, widely available | Self-service, governance at scale |
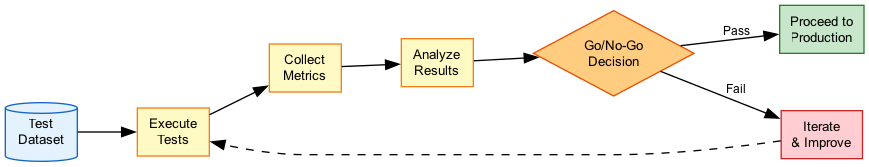
How It Works
POC Validation Flow
A/B Testing Architecture
Use Cases
Use Case 1: Customer Service Bot POC
Scenario: Validate AI-powered customer support before replacing existing FAQ system.
POC Design:
- Scope: Handle top 50 FAQ questions
- Data: 500 sample customer queries
- Models: Claude 3 Haiku vs Llama 3 8B
- Metrics: Accuracy >85%, Latency <2s, Cost <$0.01/query
Validation Process:
- Week 1: Prompt engineering and initial testing
- Week 2: A/B test with 500 queries each model
- Week 3: Human evaluation of 100 samples
- Week 4: Stakeholder review and decision
Results Example:
| Metric | Claude 3 Haiku | Llama 3 8B | Target |
|---|---|---|---|
| Accuracy | 91% | 87% | 85% |
| Latency P95 | 1.2s | 0.9s | 2s |
| Cost/query | $0.008 | $0.005 | $0.01 |
Recommendation: Deploy Claude 3 Haiku for better accuracy within budget.
Use Case 2: Document Summarization POC
Scenario: Validate AI summarization of 50-page technical documents.
POC Design:
- Scope: Summarize engineering specifications
- Data: 100 representative documents
- Models: Claude 3.5 Sonnet (200K context)
- Metrics: Completeness >90%, Key point coverage >95%
Validation Process:
- Create rubric for summary quality
- Have domain experts rate summaries
- Measure time savings vs manual summarization
- Calculate cost per document
Business Value:
- Manual: 2 hours per document × $50/hr = $100
- AI: 30 seconds + $0.50 tokens + 15 min review = $12.50
- Savings: 87% cost reduction
Use Case 3: Multi-Model A/B Test
Scenario: Determine optimal model for product recommendations.
POC Design:
- Traffic Split: 33% each to 3 models
- Models: Claude 3.5 Sonnet, Nova Pro, Llama 3 70B
- Duration: 2 weeks, 10,000 requests
- Primary Metric: Click-through rate on recommendations
A/B Test Results:
| Model | CTR | Latency | Cost/1K |
|---|---|---|---|
| Claude 3.5 | 12.3% | 1.8s | $15 |
| Nova Pro | 11.8% | 1.2s | $8 |
| Llama 3 70B | 10.9% | 1.5s | $10 |
Decision: Nova Pro offers best value (95% of Claude CTR at 53% cost).
Best Practices
POC Best Practices
- Define success criteria first - Get stakeholder agreement before starting
- Use representative data - Test with real-world examples, not synthetic data
- Include edge cases - Test failure modes and unusual inputs
- Measure what matters - Focus on business metrics, not just technical metrics
- Plan for production - Design POC architecture to be production-ready
- Document everything - Capture decisions, results, and learnings
- Set time limits - POCs should be time-boxed (2-4 weeks typical)
Common Exam Scenarios
Exam Scenarios and Solutions
| Scenario | Solution | Why |
|---|---|---|
| Need to compare 3 models for use case | A/B test with Bedrock Evaluations | Systematic comparison with metrics |
| Stakeholders want to see ROI | Calculate cost savings vs manual process | Demonstrates business value |
| POC succeeded, how to scale | Address production checklist: load testing, security, monitoring | POC patterns may not scale directly |
| Validating accuracy of responses | Use golden dataset with LLM-as-judge + human eval | Combines automated and human validation |
| Determining if POC is ready for production | Check all success metrics meet thresholds | Data-driven go/no-go decision |
Common Pitfalls
Pitfall 1: Insufficient Test Data
Mistake: Validating with 20-30 test cases and declaring success.
Why it's wrong: Small samples don't provide statistical confidence; edge cases are missed.
Correct Approach:
- Use hundreds of test cases minimum
- Include diverse scenarios and edge cases
- Calculate confidence intervals for results
- Ensure sample represents production traffic
Pitfall 2: Ignoring Production Requirements
Mistake: Building a POC that can't scale or meet security requirements.
Why it's wrong: Forces complete rebuild when moving to production.
Correct Approach:
- Design POC with production architecture in mind
- Include security controls from the start
- Test at realistic load levels
- Plan for monitoring and operations
Pitfall 3: Unclear Success Criteria
Mistake: Starting POC without defined metrics or thresholds.
Why it's wrong: No objective way to determine success; subjective decisions lead to disputes.
Correct Approach:
- Define metrics and thresholds upfront
- Get stakeholder sign-off on criteria
- Document in POC charter
- Report results against predefined targets
Test Your Knowledge
A team is conducting a POC to validate a GenAI customer support bot. What is the MINIMUM recommended sample size for validation testing?
What is the PRIMARY purpose of A/B testing during a GenAI POC?
A POC has achieved 88% accuracy, meeting the 85% target. Before moving to production, what should be validated FIRST?
Related Services
Quick Reference
POC Timeline Template
Week 1: Setup & Initial Testing
  - Define success criteria and metrics
  - Set up POC environment
  - Initial prompt engineering
  - Qualitative testing in Playground

Week 2: Systematic Evaluation
  - Create golden dataset (300+ samples)
  - Run automated evaluations
  - A/B test candidate models
  - Collect initial metrics

Week 3: Validation & Refinement
  - Human evaluation of samples
  - Address quality issues
  - Load and performance testing
  - Cost projections

Week 4: Decision & Documentation
  - Compile results vs targets
  - Stakeholder presentation
  - Go/no-go decision
  - Production planning (if approved)
POC Metrics Dashboard
Essential POC Metrics
| Category | Metric | Target | Actual | Status |
|---|---|---|---|---|
| Quality | Accuracy | >85% | 88% | ✓ Pass |
| Quality | Hallucination Rate | <5% | 3% | ✓ Pass |
| Performance | Latency P95 | <2s | 1.5s | ✓ Pass |
| Cost | Cost/Request | <$0.01 | $0.008 | ✓ Pass |
| Business | Task Completion | >80% | 82% | ✓ Pass |