hands-on labKubernetes in your browser

Inside the NVIDIA GPU Operator: From Helm to Workload-Ready

com/gpu` your workload requests. Inspect the cluster the way platform engineers do, node labels, capacity, RuntimeClass, and learn to attribute every piece of evidence to the GPU Operator component that produced it.

time
35 min
checked steps
4
level
Intermediate
setup
None

$29.99a month with Pro

Pro opens this lab and every other one. Cancel any time.

The job

You've inherited an NVIDIA-backed Kubernetes cluster. Someone installed the GPU Operator before you arrived, and now your job is to operate it, debug GPU workloads, schedule on the right hardware, recognize what each component contributes to the chain. The lab teaches the GPU Operator from the platform-engineer perspective: not "how to install it" but "how to read a cluster that already has it."

4 steps, each checked when you finish it

A check runs your work at the end of every step. Hints and the full solution are there if you get stuck.

  1. 1

    Anatomy of the GPU Operator chain

    The NVIDIA GPU Operator is a single Helm install that deploys a half-dozen cooperating components.

    read this step below ↓

  2. 2

    gpu-feature-discovery: labels for GPU-aware scheduling

    In step 1 you saw a stack of nvidia.com.

  3. 3

    RuntimeClass and the runtime path

    You've now seen what gpu-feature-discovery and the device plugin contribute.

  4. 4

    Triage Day: three pods, three broken chain links

    You've now seen each link in the chain individually.

Step 1 as it appears in the lab

The lab’s own text. The hint and the solution stay inside the lab.

Step 1: Anatomy of the GPU Operator chain

Anatomy of the GPU Operator chain

The NVIDIA GPU Operator is a single Helm install that deploys a half-dozen cooperating components. Once installed, you don't interact with it directly — you interact with the evidence it leaves on your cluster: node labels, Capacity values, a RuntimeClass, Prometheus metrics endpoints. As a platform engineer, your job is to read that evidence and trace each piece back to the component that produced it. That's the muscle memory this lab builds.

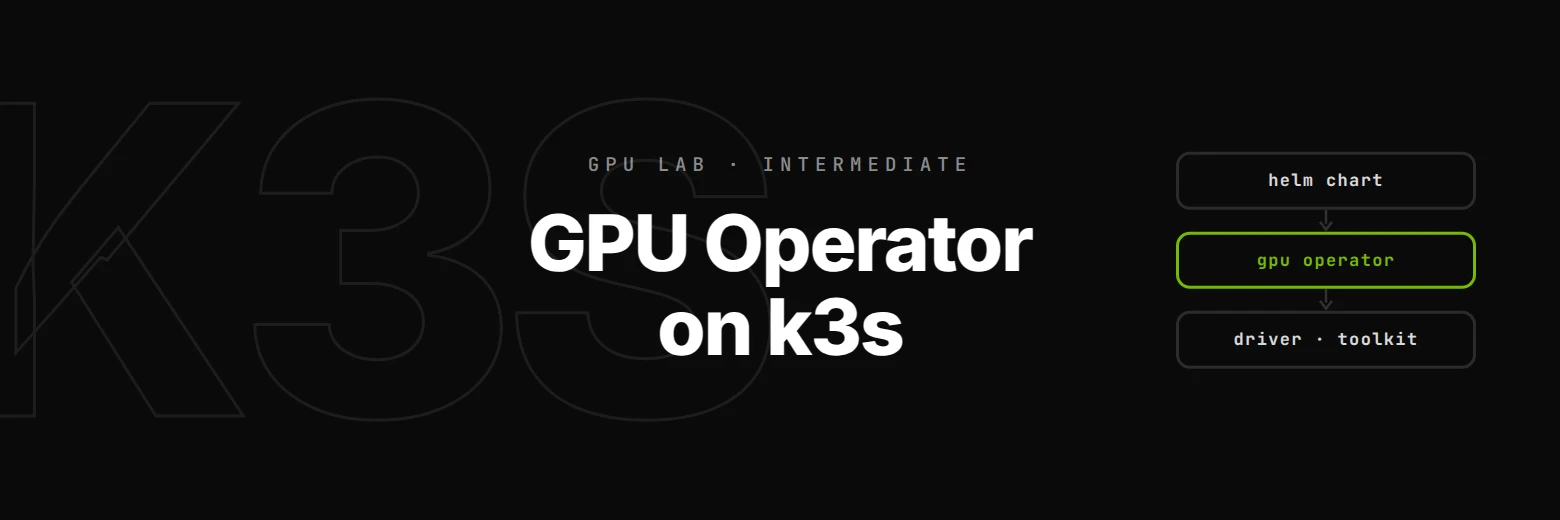
What the Operator deploys (and what each part contributes)

ComponentLives whereContributes
NVIDIA driver (host-level or daemonset)Each GPU nodeKernel module + libcuda. Without it, no /dev/nvidia* device files exist.
NVIDIA Container ToolkitEach GPU nodeModifies OCI container specs at start time to inject GPU device files and library mounts.
Device pluginDaemonSet on GPU nodesTells the kubelet "this node has N GPUs," which becomes Capacity: nvidia.com/gpu: N on the Node object.
gpu-feature-discovery (GFD)DaemonSet on GPU nodesWrites node labels: nvidia.com/gpu.product, nvidia.com/gpu.memory, nvidia.com/gpu.count, nvidia.com/gpu.deploy.*. Lets workloads target specific GPU types.
dcgm-exporterDaemonSet on GPU nodesExposes a /metrics endpoint with utilization, memory, temperature, ECC errors. Hooked by Prometheus.
RuntimeClass nvidiaCluster-wideCluster-scoped object that maps the nvidia runtime name to the kubelet's nvidia runtime handler (which is the NVIDIA Container Runtime).
Validator podRuns once at installSanity-checks that all of the above wired up correctly. Run kubectl get pods -n gpu-operator -l app=nvidia-operator-validator to see the result.
MIG manager (optional)DaemonSet on MIG-capable nodesReconfigures GPUs into MIG instances based on a node label. Only matters on A100/H100/Hopper.

The chain you care about for every GPU workload:

gpu-feature-discovery → node labels → your pod's nodeSelector
device plugin         → Capacity + Allocatable → scheduler arithmetic
RuntimeClass nvidia   → kubelet handler → NVIDIA Container Runtime → /dev/nvidia*

Three independent contributions, three independent failure modes. We'll read each one off the cluster in this step.

Five nodes, one real

kubectl get nodes lists five nodes. Four of them, the kwok-* ones, are simulated: they carry A100 and L40S labels for the multi-GPU targeting lab, but every one of them has a kwok.x-k8s.io/node=fake:NoSchedule taint, so nothing you deploy here lands on them. The fifth node is the real one. Everything in this lab runs there, and it is the node whose labels you have to read. The simulated nodes all share the type=kwok label, so kubectl get nodes -l 'type!=kwok' gives you the real node whenever you need it.

Read the cluster

Three commands give you the three pieces of evidence. Run each one in the terminal (or click Run to execute the whole batch at once):

# 1. Every node with its GPU model, GPU count and taint. Note which one has no taint.
kubectl get nodes -o custom-columns='NAME:.metadata.name,PRODUCT:.metadata.labels.nvidia\.com/gpu\.product,GPUS:.status.allocatable.nvidia\.com/gpu,TAINT:.spec.taints[*].key'

# 2. Everything the GPU Operator wrote on the real node: the `nvidia.com/gpu.*`
#    labels come from gpu-feature-discovery, the `*.deploy.*` labels are the
#    Operator's own scheduling toggles, and the `nvidia.com/gpu` rows under
#    Capacity and Allocatable come from the device plugin.
kubectl describe $(kubectl get nodes -l 'type!=kwok' -o name) | grep nvidia.com

# 3. RuntimeClasses — cluster-scoped runtime selectors. The `nvidia` row is
#    what GPU pods reference; the `handler` column is the runtime *name* the
#    kubelet looks up in its own config.
kubectl get runtimeclass

After running, take a moment to think about what would happen to a GPU pod if each of these three (labels, Capacity, RuntimeClass) were missing. Use the table above to map your prediction. The quiz below pins the cluster's actual values into your head.

Why this matters in practice: when a GPU workload won't run, the chain has three fundamentally different breakage points. Knowing which evidence to inspect first (describe node for labels and Capacity, get runtimeclass for the runtime path) cuts diagnosis from minutes to seconds. The NCA-AIIO exam tests this through scenarios where you're given a symptom ("Pod is Pending — Insufficient nvidia.com/gpu" vs "Running but no GPU mounted") and asked which component is at fault.
what you get

  • A Kubernetes cluster and terminal in your browser
  • A check at the end of every step
  • Hints and the full solution
  • Nothing to install or configure

before you start

  • Completed `nca-aiio-resource-requests-limits` (or comfortable with kubectl + GPU pod manifests)
  • Familiar with `kubectl describe`, events, and Pending/ContainerCreating diagnosis

Exam domains covered

AI Infrastructure & OperationsGPU Acceleration & Distributed Training

Part of the GPU and Kubernetes track

Lab 3 of 20. GPU scheduling on your own Kubernetes cluster, the GPU Operator, CUDA kernels and profiling.

Questions about this lab

What components does the NVIDIA GPU Operator deploy?

The GPU Operator is a Helm-installed bundle that deploys: the NVIDIA driver (or assumes a host-level install), the NVIDIA Container Toolkit (modifies OCI specs to inject GPU mounts), the device plugin (advertises nvidia.com/gpu capacity to the kubelet), gpu-feature-discovery (writes nvidia.com/gpu.product, nvidia.com/gpu.memory, etc. node labels), dcgm-exporter (Prometheus metrics for utilization, errors, and temperature), the MIG manager (when MIG is enabled), and a validator (post-install sanity check). The lab walks through what each one contributes to the cluster you can see with kubectl, so you can debug workloads by reading those contributions rather than by SSHing into operator pods.

What's a RuntimeClass and how does it relate to GPUs?

RuntimeClass is the Kubernetes API for selecting a non-default container runtime. The kubelet maps each RuntimeClass to a runtime handler defined in its config, the nvidia RuntimeClass typically maps to the NVIDIA Container Runtime, which intercepts container starts to inject GPU device files (/dev/nvidia0, /dev/nvidiactl) and the libcuda libraries. Without runtimeClassName: nvidia, even a pod that requests nvidia.com/gpu: 1 runs under the default runtime (runc) and never gets GPU access, nvidia-smi returns "command not found." This is one of the most common GPU-pod misconfigurations in production.

Why does my GPU pod stay Pending with 'didn't match Pod's node affinity/selector'?

Because some node label your pod requested doesn't exist on any node. The most common variant: nodeSelector: nvidia.com/gpu.product: NVIDIA-A100 when your fleet only has Tesla-K80s. gpu-feature-discovery writes whatever the actual hardware reports; if your nodeSelector targets a different model, the scheduler can't find a candidate node. The fix is to either match the actual nvidia.com/gpu.product value or remove the selector entirely. Run kubectl get node -o jsonpath='{.items[*].metadata.labels}' | tr ',' '\n' | grep nvidia to see what's actually labeled.

What you'll learn

The NVIDIA GPU Operator is the single most important piece of the NCA-AIIO certification's infrastructure section, and the most common source of confusion when a GPU workload won't schedule. This lab teaches it from the angle that actually matters in production: not the Helm install, but the evidence the Operator leaves on your cluster, the node labels written by gpu-feature-discovery, the Capacity contributed by the device plugin, the RuntimeClass that selects the NVIDIA Container Runtime, the metrics emitted by dcgm-exporter. You learn to attribute every piece of that evidence to the component that produced it, then walk three broken GPU pods backward through the chain to find the source of the failure.

The lab finishes with a Triage Day where three GPU pods are deliberately broken, one in scheduling, one in runtime selection, one in the request shape, and you fix each one by reading the cluster's response. This is the daily work of an NVIDIA platform engineer and the exact pattern the NCA-AIIO exam tests under the AI Infrastructure & Operations domain.